
สร้าง Admin Monitoring Dashboard แบบ Real-time
สร้าง Admin Monitoring Dashboard แบบ Real-time
Branch:
workshop/dev-17-admin-monitoringPhase: Development (17/21) Repo: kangana1024/iot-workshop
สวัสดีน้องๆ ทุกคน! เรากลับมาแล้ว (ง่ะ•̀ω•́)ง
วันนี้เราจะมาทำของที่ “Admin คนเดียวรู้เรื่อง แต่ทุกคนได้ประโยชน์” — นั่นก็คือ Monitoring Dashboard หน้าแรกที่ Admin จะเห็นเวลาเปิด Panel ขึ้นมา
ลองนึกภาพว่าคุณเป็นยามรักษาความปลอดภัยโรงงานขนาดใหญ่ คุณต้องดูกล้องวงจรปิดหลายสิบตัวพร้อมกัน ดูไฟเตือน ดูว่าระบบไหน OK ระบบไหนพัง Dashboard ของเราก็ทำหน้าที่แบบนั้นแหละ แต่สำหรับ IoT devices ทั้งหมดในระบบ
มาลุยกัน!
สิ่งที่น้องๆ จะได้เรียนรู้วันนี้
- ทำไมต้องมี Monitoring Dashboard (WHY ก่อนนะ!)
- สร้าง TypeScript Types สำหรับระบบ Monitoring
- เขียน API Service layer
- สร้าง Component แต่ละชิ้น ได้แก่ Overview Cards, Chronograf Iframe, Device Grid, Alert Management, Service Health, Data Export
- รวมทุกอย่างใน MonitoringPage
ทำไมต้องมี Dashboard? (WHY)
  ╔══════════════════════════════════╗
  ║  ถ้าไม่มี Dashboard...           ║
  ║                                  ║
  ║  Admin: "device-007 พังเมื่อไหร่?"║
  ║  Dev:   "เดี๋ยวไปดู log..."       ║
  ║  Admin: "alert ไปแล้วหรือยัง?"   ║
  ║  Dev:   "เดี๋ยวไปเช็ค DB..."      ║
  ║  Admin: (╯°□°)╯︵ ┻━┻           ║
  ╚══════════════════════════════════╝
ถ้าเราไม่มีหน้า Monitor รวม ทุกคนต้องวิ่งไปเปิด log, เปิด database, เปิด Chronograf แยกกันทีละหน้าตลอดเวลา นั่นคือ “ข้อมูลมีอยู่ แต่หาไม่เจอ”
Monitoring Dashboard แก้ปัญหานี้ด้วยการรวมทุกอย่างไว้ที่เดียว ทำให้ Admin เห็นภาพรวมระบบทั้งหมดได้ใน 3 วินาทีแรกที่เปิดหน้า
ภาพรวมสถาปัตยกรรม
ก่อนลงมือ มาดู flow ของ Dashboard ทั้งหมดกันก่อน:

เหมือนห้อง Control Room ของโรงไฟฟ้าเลย — จอหนึ่งดู Overview, จอสองดู Graphs, จออื่นดู Alerts แต่เราทำทุกอย่างในหน้าเดียว!
Step 1: TypeScript Types สำหรับ Monitoring
ทำไมต้องเริ่มจาก Types?
เพราะ Types เปรียบเหมือน “สัญญา” ระหว่าง Frontend กับ Backend ถ้ากำหนดไว้ชัดเจนตั้งแต่ต้น ทีม Frontend และ Backend จะทำงานคู่ขนานกันได้เลยโดยไม่ต้องรอกัน
สร้าง src/types/monitoring.types.ts:
export type AlertSeverity = 'critical' | 'warning' | 'info'
export type AlertStatus = 'open' | 'acknowledged' | 'resolved'
export type ServiceHealth = 'healthy' | 'degraded' | 'down'

export interface SystemOverview {
  totalDevices: number
  onlineDevices: number
  offlineDevices: number
  errorDevices: number
  activeAlerts: number
  criticalAlerts: number
  dataPointsToday: number
  mqttConnections: number
}

export interface DeviceStatusItem {
  id: string
  deviceId: string
  name: string
  type: string
  status: 'online' | 'offline' | 'maintenance' | 'error'
  location: string
  lastSeen: string
  metrics?: {
    temperature?: number
    humidity?: number
    battery?: number
    signal?: number
  }
}

export interface Alert {
  id: string
  deviceId: string
  deviceName: string
  severity: AlertSeverity
  status: AlertStatus
  title: string
  message: string
  metric?: string
  value?: number
  threshold?: number
  acknowledgedBy?: string
  acknowledgedAt?: string
  resolvedAt?: string
  createdAt: string
  updatedAt: string
}

export interface ServiceHealthStatus {
  name: string
  status: ServiceHealth
  latency?: number
  lastCheck: string
  details?: string
}

export interface ExportOptions {
  format: 'csv' | 'json'
  startDate: string
  endDate: string
  deviceIds?: string[]
  metrics?: string[]
}
Types ทั้งหมดนี้สะท้อนสิ่งที่เราต้องการแสดงบน Dashboard ครบเลย ทั้ง device status, alerts, service health และ export options
Step 2: Monitoring API Service
ทำไมต้อง Service Layer?
เราแยก logic การยิง API ออกมาเป็น service แทนที่จะเขียนตรงใน Component เพราะถ้าวันหนึ่ง Backend เปลี่ยน endpoint เราแก้แค่ที่เดียว ไม่ต้องวิ่งหาแก้ทุก Component เหมือนร้านอาหารที่มีเมนูกลาง แทนที่จะให้พนักงานแต่ละคนจำเมนูเอง
สร้าง src/services/monitoring.service.ts:
import api from './api'
import type { ApiResponse } from '@types/api.types'
import type {
  SystemOverview,
  DeviceStatusItem,
  Alert,
  ServiceHealthStatus,
  ExportOptions,
} from '@types/monitoring.types'

export const monitoringService = {
  // ดึง system overview
  async getSystemOverview(): Promise<ApiResponse<SystemOverview>> {
    const response = await api.get<ApiResponse<SystemOverview>>('/monitoring/overview')
    return response.data
  },

  // ดึงสถานะ devices ทั้งหมด
  async getDeviceStatuses(): Promise<ApiResponse<DeviceStatusItem[]>> {
    const response = await api.get<ApiResponse<DeviceStatusItem[]>>('/monitoring/devices')
    return response.data
  },

  // ดึง alerts
  async getAlerts(params?: {
    status?: string
    severity?: string
    limit?: number
  }): Promise<ApiResponse<Alert[]>> {
    const query = new URLSearchParams()
    if (params?.status) query.set('status', params.status)
    if (params?.severity) query.set('severity', params.severity)
    if (params?.limit) query.set('limit', String(params.limit))
    const response = await api.get<ApiResponse<Alert[]>>(`/monitoring/alerts?${query}`)
    return response.data
  },

  // Acknowledge alert
  async acknowledgeAlert(id: string): Promise<ApiResponse<Alert>> {
    const response = await api.patch<ApiResponse<Alert>>(
      `/monitoring/alerts/${id}/acknowledge`
    )
    return response.data
  },

  // Resolve alert
  async resolveAlert(id: string): Promise<ApiResponse<Alert>> {
    const response = await api.patch<ApiResponse<Alert>>(
      `/monitoring/alerts/${id}/resolve`
    )
    return response.data
  },

  // Escalate alert
  async escalateAlert(id: string, note: string): Promise<ApiResponse<Alert>> {
    const response = await api.patch<ApiResponse<Alert>>(
      `/monitoring/alerts/${id}/escalate`,
      { note }
    )
    return response.data
  },

  // ดึง service health
  async getServiceHealth(): Promise<ApiResponse<ServiceHealthStatus[]>> {
    const response = await api.get<ApiResponse<ServiceHealthStatus[]>>(
      '/monitoring/health'
    )
    return response.data
  },

  // Export data
  async exportData(options: ExportOptions): Promise<Blob> {
    const response = await api.post('/monitoring/export', options, {
      responseType: 'blob',
    })
    return response.data
  },
}
สังเกตว่า escalateAlert รับ note ด้วย เผื่อวันหนึ่งอยากบอกว่า escalate เพราะอะไร ออกแบบ extensible ไว้ก่อนเลย
Step 3: System Overview Cards Component
ทำไมต้องมี Overview Cards?
มันเหมือนหน้าปัดรถยนต์ — ขณะขับรถ คุณต้องการรู้แค่ความเร็ว, น้ำมัน, และอุณหภูมิเครื่องยนต์ ไม่ใช่ spec sheet ทั้งหมด Overview Cards ทำหน้าที่เดียวกัน ให้ข้อมูลสำคัญที่สุดในทันที
สร้าง src/components/monitoring/OverviewCards.tsx:
import { Cpu, Wifi, WifiOff, AlertTriangle, Activity, Database, Signal } from 'lucide-react'
import { clsx } from 'clsx'
import type { SystemOverview } from '@types/monitoring.types'

interface StatCardProps {
  title: string
  value: number | string
  icon: React.ElementType
  iconColor: string
  iconBg: string
  trend?: {
    value: number
    label: string
    positive?: boolean
  }
  subtitle?: string
}

function StatCard({ title, value, icon: Icon, iconColor, iconBg, trend, subtitle }: StatCardProps) {
  return (
    <div className="card">
      <div className="flex items-start justify-between">
        <div className="flex-1 min-w-0">
          <p className="text-sm text-gray-500">{title}</p>
          <p className="mt-1 text-2xl font-bold text-gray-900">
            {typeof value === 'number' ? value.toLocaleString() : value}
          </p>
          {subtitle && <p className="mt-0.5 text-xs text-gray-400">{subtitle}</p>}
          {trend && (
            <p
              className={clsx(
                'mt-1 text-xs font-medium',
                trend.positive ? 'text-green-600' : 'text-red-600'
              )}
            >
              {trend.positive ? '▲' : '▼'} {trend.value}% {trend.label}
            </p>
          )}
        </div>
        <div className={clsx('p-3 rounded-xl flex-shrink-0', iconBg)}>
          <Icon className={clsx('w-6 h-6', iconColor)} />
        </div>
      </div>
    </div>
  )
}

interface OverviewCardsProps {
  data: SystemOverview
}

export function OverviewCards({ data }: OverviewCardsProps) {
  const onlinePercent =
    data.totalDevices > 0
      ? Math.round((data.onlineDevices / data.totalDevices) * 100)
      : 0

  return (
    <div className="grid grid-cols-2 lg:grid-cols-4 gap-4">
      <StatCard
        title="อุปกรณ์ทั้งหมด"
        value={data.totalDevices}
        icon={Cpu}
        iconColor="text-blue-600"
        iconBg="bg-blue-50"
        subtitle={`ออนไลน์ ${onlinePercent}%`}
      />
      <StatCard
        title="ออนไลน์"
        value={data.onlineDevices}
        icon={Wifi}
        iconColor="text-green-600"
        iconBg="bg-green-50"
        trend={{ value: onlinePercent, label: 'ของทั้งหมด', positive: onlinePercent >= 80 }}
      />
      <StatCard
        title="ออฟไลน์ / ผิดพลาด"
        value={data.offlineDevices + data.errorDevices}
        icon={WifiOff}
        iconColor="text-red-600"
        iconBg="bg-red-50"
        subtitle={`ผิดพลาด ${data.errorDevices} เครื่อง`}
      />
      <StatCard
        title="Alerts ที่ยังเปิดอยู่"
        value={data.activeAlerts}
        icon={AlertTriangle}
        iconColor="text-yellow-600"
        iconBg="bg-yellow-50"
        subtitle={`วิกฤต ${data.criticalAlerts} รายการ`}
      />
      <StatCard
        title="Data Points วันนี้"
        value={data.dataPointsToday}
        icon={Database}
        iconColor="text-purple-600"
        iconBg="bg-purple-50"
      />
      <StatCard
        title="MQTT Connections"
        value={data.mqttConnections}
        icon={Signal}
        iconColor="text-indigo-600"
        iconBg="bg-indigo-50"
        subtitle="Active connections"
      />
      <div className="card col-span-2 flex items-center justify-center">
        <div className="text-center">
          <div
            className={clsx(
              'w-16 h-16 rounded-full flex items-center justify-center mx-auto mb-2',
              onlinePercent >= 90
                ? 'bg-green-100'
                : onlinePercent >= 70
                ? 'bg-yellow-100'
                : 'bg-red-100'
            )}
          >
            <Activity
              className={clsx(
                'w-8 h-8',
                onlinePercent >= 90
                  ? 'text-green-600'
                  : onlinePercent >= 70
                  ? 'text-yellow-600'
                  : 'text-red-600'
              )}
            />
          </div>
          <p className="font-semibold text-gray-900">
            System Status:{' '}
            {onlinePercent >= 90
              ? 'ปกติ'
              : onlinePercent >= 70
              ? 'ลดประสิทธิภาพ'
              : 'มีปัญหา'}
          </p>
          <p className="text-sm text-gray-500">
            อุปกรณ์ออนไลน์ {onlinePercent}% ({data.onlineDevices}/{data.totalDevices})
          </p>
        </div>
      </div>
    </div>
  )
}
Card ตัวสุดท้ายที่ col-span-2 นั้นทำหน้าที่เป็น “สรุปสุขภาพระบบ” เหมือน Traffic Light — เขียว/เหลือง/แดง บอกได้ทันทีว่าระบบโอเคไหม
Step 4: Chronograf Iframe Component
ทำไมต้อง Embed Chronograf แทนทำ Chart เอง?
Chronograf เป็นเครื่องมือ visualize InfluxDB ที่ทรงพลังมาก การสร้าง Chart ใหม่เองนั้นสิ้นเปลืองเวลาโดยไม่จำเป็น ลองนึกภาพว่าคุณมีจอ 4K อยู่แล้วในห้อง แต่จะไปซื้อจอใหม่เพิ่มอีกอันเพราะอยากให้มันอยู่ในกรอบสวยงาม ไม่ต้องถึงขนาดนั้น — embed มันเข้ามาพอ!
สร้าง src/components/monitoring/ChronografEmbed.tsx:
import { useState, useRef } from 'react'
import { ExternalLink, RefreshCw, Maximize2, Minimize2 } from 'lucide-react'
import { clsx } from 'clsx'

interface ChronografDashboard {
  id: string
  name: string
  url: string
}

const CHRONOGRAF_DASHBOARDS: ChronografDashboard[] = [
  {
    id: 'overview',
    name: 'System Overview',
    url: `${import.meta.env.VITE_CHRONOGRAF_URL || 'http://localhost:8888'}/sources/1/dashboards/1`,
  },
  {
    id: 'devices',
    name: 'Device Metrics',
    url: `${import.meta.env.VITE_CHRONOGRAF_URL || 'http://localhost:8888'}/sources/1/dashboards/2`,
  },
  {
    id: 'alerts',
    name: 'Alert History',
    url: `${import.meta.env.VITE_CHRONOGRAF_URL || 'http://localhost:8888'}/sources/1/dashboards/3`,
  },
]

interface ChronografEmbedProps {
  height?: number
}

export function ChronografEmbed({ height = 600 }: ChronografEmbedProps) {
  const [activeDashboard, setActiveDashboard] = useState(CHRONOGRAF_DASHBOARDS[0])
  const [isFullscreen, setIsFullscreen] = useState(false)
  const [refreshKey, setRefreshKey] = useState(0)
  const [isLoading, setIsLoading] = useState(true)
  const iframeRef = useRef<HTMLIFrameElement>(null)

  const handleRefresh = () => {
    setIsLoading(true)
    setRefreshKey((k) => k + 1)
  }

  return (
    <div
      className={clsx(
        'card p-0 overflow-hidden',
        isFullscreen && 'fixed inset-4 z-50 shadow-2xl'
      )}
    >
      {/* Header */}
      <div className="flex items-center justify-between px-4 py-3 border-b border-gray-200 bg-gray-50">
        <div className="flex items-center gap-1">
          {CHRONOGRAF_DASHBOARDS.map((dashboard) => (
            <button
              key={dashboard.id}
              onClick={() => {
                setActiveDashboard(dashboard)
                setIsLoading(true)
              }}
              className={clsx(
                'px-3 py-1.5 rounded-lg text-sm font-medium transition-colors',
                activeDashboard.id === dashboard.id
                  ? 'bg-primary-600 text-white'
                  : 'text-gray-600 hover:bg-gray-200'
              )}
            >
              {dashboard.name}
            </button>
          ))}
        </div>

        <div className="flex items-center gap-2">
          <button
            onClick={handleRefresh}
            className="p-1.5 rounded-lg hover:bg-gray-200 text-gray-500 transition-colors"
            title="รีเฟรช"
          >
            <RefreshCw className={clsx('w-4 h-4', isLoading && 'animate-spin')} />
          </button>
          <a
            href={activeDashboard.url}
            target="_blank"
            rel="noopener noreferrer"
            className="p-1.5 rounded-lg hover:bg-gray-200 text-gray-500 transition-colors"
            title="เปิดใน Chronograf"
          >
            <ExternalLink className="w-4 h-4" />
          </a>
          <button
            onClick={() => setIsFullscreen((f) => !f)}
            className="p-1.5 rounded-lg hover:bg-gray-200 text-gray-500 transition-colors"
            title={isFullscreen ? 'ย่อ' : 'ขยาย'}
          >
            {isFullscreen ? (
              <Minimize2 className="w-4 h-4" />
            ) : (
              <Maximize2 className="w-4 h-4" />
            )}
          </button>
        </div>
      </div>

      {/* Iframe */}
      <div className="relative" style={{ height: isFullscreen ? 'calc(100% - 49px)' : height }}>
        {isLoading && (
          <div className="absolute inset-0 flex items-center justify-center bg-gray-50 z-10">
            <div className="text-center">
              <div className="w-10 h-10 border-4 border-primary-600 border-t-transparent rounded-full animate-spin mx-auto mb-3" />
              <p className="text-sm text-gray-500">กำลังโหลด Chronograf...</p>
            </div>
          </div>
        )}
        <iframe
          key={refreshKey}
          ref={iframeRef}
          src={activeDashboard.url}
          className="w-full h-full border-0"
          title={`Chronograf: ${activeDashboard.name}`}
          onLoad={() => setIsLoading(false)}
          sandbox="allow-scripts allow-same-origin allow-forms allow-popups"
        />
      </div>
    </div>
  )
}
หมายเหตุสำคัญ! Chronograf ต้องตั้งค่า CORS และ
X-Frame-Optionsให้อนุญาต domain ของ Admin Panel ด้วย ไม่งั้น iframe จะโหลดไม่ขึ้นเลย — มันเหมือนเปิดประตูรั้วบ้านให้แขกเข้ามาได้ ถ้าลืมเปิดล็อคก็เข้าไม่ได้อยู่ดี
Step 5: Real-time Device Status Grid
ทำไมต้อง refresh ทุก 30 วินาที?
เพราะ IoT devices อาจ offline หรือ error ได้ตลอดเวลา ถ้าแสดงข้อมูลเก่าอยู่ Admin จะเข้าใจผิดว่าทุกอย่าง OK ทั้งที่จริงๆ อาจมีปัญหาอยู่แล้ว เปรียบเหมือนนาฬิกาที่หยุดเดิน — ถูกสองครั้งต่อวัน แต่ไม่มีประโยชน์อะไรเลย
เราใช้ refetchInterval ของ TanStack Query แทน WebSocket เพราะข้อมูลสถานะนี้ไม่ต้องการ latency ต่ำมาก 30 วินาทีเพียงพอแล้ว และง่ายกว่ามาก
สร้าง src/components/monitoring/DeviceStatusGrid.tsx:
import { useEffect } from 'react'
import { useQuery, useQueryClient } from '@tanstack/react-query'
import { Wifi, WifiOff, AlertTriangle, Wrench, Thermometer, Droplets, Battery, Signal } from 'lucide-react'
import { clsx } from 'clsx'
import { monitoringService } from '@services/monitoring.service'
import type { DeviceStatusItem } from '@types/monitoring.types'

const STATUS_CONFIG = {
  online: {
    icon: Wifi,
    label: 'ออนไลน์',
    iconColor: 'text-green-500',
    bgColor: 'bg-green-50',
    borderColor: 'border-green-200',
    dotColor: 'bg-green-500',
  },
  offline: {
    icon: WifiOff,
    label: 'ออฟไลน์',
    iconColor: 'text-gray-400',
    bgColor: 'bg-gray-50',
    borderColor: 'border-gray-200',
    dotColor: 'bg-gray-400',
  },
  error: {
    icon: AlertTriangle,
    label: 'ผิดพลาด',
    iconColor: 'text-red-500',
    bgColor: 'bg-red-50',
    borderColor: 'border-red-200',
    dotColor: 'bg-red-500',
  },
  maintenance: {
    icon: Wrench,
    label: 'บำรุงรักษา',
    iconColor: 'text-yellow-500',
    bgColor: 'bg-yellow-50',
    borderColor: 'border-yellow-200',
    dotColor: 'bg-yellow-500',
  },
}

function DeviceCard({ device }: { device: DeviceStatusItem }) {
  const config = STATUS_CONFIG[device.status]
  const StatusIcon = config.icon

  const timeSince = (date: string) => {
    const seconds = Math.floor((Date.now() - new Date(date).getTime()) / 1000)
    if (seconds < 60) return `${seconds} วิ`
    const minutes = Math.floor(seconds / 60)
    if (minutes < 60) return `${minutes} นาที`
    const hours = Math.floor(minutes / 60)
    if (hours < 24) return `${hours} ชม.`
    return `${Math.floor(hours / 24)} วัน`
  }

  return (
    <div
      className={clsx(
        'rounded-xl border p-4 transition-all hover:shadow-md',
        config.bgColor,
        config.borderColor
      )}
    >
      {/* Header */}
      <div className="flex items-start justify-between mb-3">
        <div className="flex items-center gap-2 min-w-0">
          <div className="relative flex-shrink-0">
            <StatusIcon className={clsx('w-5 h-5', config.iconColor)} />
            {device.status === 'online' && (
              <span className="absolute -top-0.5 -right-0.5 w-2 h-2 bg-green-500 rounded-full animate-pulse" />
            )}
          </div>
          <div className="min-w-0">
            <p className="font-medium text-gray-900 truncate text-sm">{device.name}</p>
            <p className="text-xs text-gray-500 truncate">{device.location}</p>
          </div>
        </div>
        <span
          className={clsx(
            'flex-shrink-0 text-xs px-2 py-0.5 rounded-full font-medium',
            device.status === 'online' && 'bg-green-100 text-green-700',
            device.status === 'offline' && 'bg-gray-100 text-gray-600',
            device.status === 'error' && 'bg-red-100 text-red-700',
            device.status === 'maintenance' && 'bg-yellow-100 text-yellow-700'
          )}
        >
          {config.label}
        </span>
      </div>

      {/* Metrics */}
      {device.metrics && (
        <div className="grid grid-cols-2 gap-2 mb-3">
          {device.metrics.temperature !== undefined && (
            <div className="flex items-center gap-1.5 text-xs text-gray-600">
              <Thermometer className="w-3.5 h-3.5 text-orange-400" />
              <span>{device.metrics.temperature.toFixed(1)}°C</span>
            </div>
          )}
          {device.metrics.humidity !== undefined && (
            <div className="flex items-center gap-1.5 text-xs text-gray-600">
              <Droplets className="w-3.5 h-3.5 text-blue-400" />
              <span>{device.metrics.humidity.toFixed(1)}%</span>
            </div>
          )}
          {device.metrics.battery !== undefined && (
            <div className="flex items-center gap-1.5 text-xs text-gray-600">
              <Battery
                className={clsx(
                  'w-3.5 h-3.5',
                  device.metrics.battery < 20 ? 'text-red-400' : 'text-green-400'
                )}
              />
              <span>{device.metrics.battery}%</span>
            </div>
          )}
          {device.metrics.signal !== undefined && (
            <div className="flex items-center gap-1.5 text-xs text-gray-600">
              <Signal className="w-3.5 h-3.5 text-purple-400" />
              <span>{device.metrics.signal} dBm</span>
            </div>
          )}
        </div>
      )}

      {/* Footer */}
      <div className="flex items-center justify-between text-xs text-gray-400">
        <span className="font-mono">{device.deviceId}</span>
        <span>เห็นล่าสุด {timeSince(device.lastSeen)}</span>
      </div>
    </div>
  )
}

const REFRESH_INTERVAL = 30_000 // 30 seconds

export function DeviceStatusGrid() {
  const queryClient = useQueryClient()

  const { data, isLoading, dataUpdatedAt } = useQuery({
    queryKey: ['device-statuses'],
    queryFn: monitoringService.getDeviceStatuses,
    refetchInterval: REFRESH_INTERVAL,
    staleTime: REFRESH_INTERVAL - 5000,
  })

  const devices = data?.data ?? []
  const onlineCount = devices.filter((d) => d.status === 'online').length
  const errorCount = devices.filter((d) => d.status === 'error').length

  return (
    <div className="space-y-4">
      <div className="flex items-center justify-between">
        <h2 className="text-base font-semibold text-gray-800">
          สถานะอุปกรณ์ Real-time
        </h2>
        <div className="flex items-center gap-3 text-xs text-gray-500">
          <span className="flex items-center gap-1">
            <span className="w-2 h-2 rounded-full bg-green-500" />
            ออนไลน์ {onlineCount}
          </span>
          <span className="flex items-center gap-1">
            <span className="w-2 h-2 rounded-full bg-red-500" />
            ผิดพลาด {errorCount}
          </span>
          {dataUpdatedAt > 0 && (
            <span>
              อัปเดต {new Date(dataUpdatedAt).toLocaleTimeString('th-TH')}
            </span>
          )}
        </div>
      </div>

      {isLoading ? (
        <div className="grid grid-cols-2 md:grid-cols-3 lg:grid-cols-4 xl:grid-cols-5 gap-3">
          {Array.from({ length: 10 }).map((_, i) => (
            <div key={i} className="h-32 bg-gray-100 rounded-xl animate-pulse" />
          ))}
        </div>
      ) : devices.length === 0 ? (
        <div className="card py-12 text-center text-gray-500">ไม่พบอุปกรณ์</div>
      ) : (
        <div className="grid grid-cols-2 md:grid-cols-3 lg:grid-cols-4 xl:grid-cols-5 gap-3">
          {devices.map((device) => (
            <DeviceCard key={device.id} device={device} />
          ))}
        </div>
      )}
    </div>
  )
}
จุดนึงที่น่าสนใจคือ staleTime: REFRESH_INTERVAL - 5000 — เราตั้ง stale time ให้น้อยกว่า refresh interval 5 วินาที เพื่อให้ TanStack Query รู้ว่าข้อมูลเก่าแล้วก่อน interval จะหมด เหมือนเตือนตัวเองว่า “อีก 5 วินาทีจะต้องไปซื้อกาแฟแล้วนะ” แทนที่จะรอให้หิวก่อนค่อยลุก
Step 6: Alert Management Component
ทำไมต้องมี Alert Management?
การมี Alert โดยไม่มีระบบจัดการมันก็เหมือนมีกล่องจดหมายที่ไม่มีวันเปิดดู ข้อความเยอะแต่ไม่ได้ action อะไรเลย เราต้องการ workflow ที่ชัดเจน: เห็น Alert → รับทราบ → แก้ไข → ปิด หรือ Escalate ให้คนอื่นจัดการ
สร้าง src/components/monitoring/AlertManagement.tsx:
import { useState } from 'react'
import { AlertTriangle, Bell, CheckCircle, ChevronUp, Clock, Filter, X } from 'lucide-react'
import { clsx } from 'clsx'
import { toast } from 'sonner'
import { useQuery, useMutation, useQueryClient } from '@tanstack/react-query'
import { monitoringService } from '@services/monitoring.service'
import type { Alert, AlertSeverity, AlertStatus } from '@types/monitoring.types'

const SEVERITY_CONFIG: Record<AlertSeverity, { label: string; color: string; icon: React.ElementType }> = {
  critical: { label: 'วิกฤต', color: 'text-red-600 bg-red-50 border-red-200', icon: AlertTriangle },
  warning: { label: 'เตือน', color: 'text-yellow-600 bg-yellow-50 border-yellow-200', icon: Bell },
  info: { label: 'ข้อมูล', color: 'text-blue-600 bg-blue-50 border-blue-200', icon: Bell },
}

const STATUS_LABEL: Record<AlertStatus, string> = {
  open: 'เปิดอยู่',
  acknowledged: 'รับทราบแล้ว',
  resolved: 'แก้ไขแล้ว',
}

interface AlertRowProps {
  alert: Alert
  onAcknowledge: (id: string) => void
  onResolve: (id: string) => void
  onEscalate: (id: string) => void
}

function AlertRow({ alert, onAcknowledge, onResolve, onEscalate }: AlertRowProps) {
  const config = SEVERITY_CONFIG[alert.severity]
  const Icon = config.icon
  const timeAgo = (date: string) => {
    const minutes = Math.floor((Date.now() - new Date(date).getTime()) / 60000)
    if (minutes < 60) return `${minutes} นาทีที่แล้ว`
    const hours = Math.floor(minutes / 60)
    if (hours < 24) return `${hours} ชั่วโมงที่แล้ว`
    return `${Math.floor(hours / 24)} วันที่แล้ว`
  }

  return (
    <div className={clsx('flex items-start gap-3 p-4 rounded-lg border', config.color)}>
      <Icon className="w-5 h-5 flex-shrink-0 mt-0.5" />
      <div className="flex-1 min-w-0">
        <div className="flex items-start justify-between gap-2">
          <div>
            <p className="font-medium text-sm">{alert.title}</p>
            <p className="text-xs mt-0.5 opacity-80">{alert.message}</p>
          </div>
          <span className="flex-shrink-0 text-xs opacity-70">
            {timeAgo(alert.createdAt)}
          </span>
        </div>
        <div className="mt-2 flex items-center gap-3 flex-wrap">
          <span className="text-xs font-mono opacity-70">{alert.deviceName}</span>
          {alert.metric && alert.value !== undefined && (
            <span className="text-xs">
              {alert.metric}: <strong>{alert.value}</strong>
              {alert.threshold && ` (เกณฑ์: ${alert.threshold})`}
            </span>
          )}
          <span className="text-xs">
            สถานะ: {STATUS_LABEL[alert.status]}
          </span>
          {alert.acknowledgedBy && (
            <span className="text-xs opacity-70">รับทราบโดย: {alert.acknowledgedBy}</span>
          )}
        </div>

        {/* Actions */}
        {alert.status === 'open' && (
          <div className="mt-2 flex gap-2">
            <button
              onClick={() => onAcknowledge(alert.id)}
              className="text-xs px-2 py-1 bg-white/60 hover:bg-white rounded border border-current/20 transition-colors font-medium"
            >
              <CheckCircle className="w-3 h-3 inline mr-1" />
              รับทราบ
            </button>
            <button
              onClick={() => onResolve(alert.id)}
              className="text-xs px-2 py-1 bg-white/60 hover:bg-white rounded border border-current/20 transition-colors font-medium"
            >
              <X className="w-3 h-3 inline mr-1" />
              ปิด Alert
            </button>
            {alert.severity !== 'critical' && (
              <button
                onClick={() => onEscalate(alert.id)}
                className="text-xs px-2 py-1 bg-white/60 hover:bg-white rounded border border-current/20 transition-colors font-medium"
              >
                <ChevronUp className="w-3 h-3 inline mr-1" />
                Escalate
              </button>
            )}
          </div>
        )}
        {alert.status === 'acknowledged' && (
          <div className="mt-2">
            <button
              onClick={() => onResolve(alert.id)}
              className="text-xs px-2 py-1 bg-white/60 hover:bg-white rounded border border-current/20 transition-colors font-medium"
            >
              <CheckCircle className="w-3 h-3 inline mr-1" />
              ปิด Alert
            </button>
          </div>
        )}
      </div>
    </div>
  )
}

export function AlertManagement() {
  const queryClient = useQueryClient()
  const [statusFilter, setStatusFilter] = useState<AlertStatus | 'all'>('open')
  const [severityFilter, setSeverityFilter] = useState<AlertSeverity | 'all'>('all')

  const { data, isLoading } = useQuery({
    queryKey: ['alerts', { status: statusFilter, severity: severityFilter }],
    queryFn: () =>
      monitoringService.getAlerts({
        status: statusFilter !== 'all' ? statusFilter : undefined,
        severity: severityFilter !== 'all' ? severityFilter : undefined,
        limit: 50,
      }),
    refetchInterval: 60_000,
  })

  const ackMutation = useMutation({
    mutationFn: monitoringService.acknowledgeAlert,
    onSuccess: () => {
      toast.success('รับทราบ Alert แล้ว')
      queryClient.invalidateQueries({ queryKey: ['alerts'] })
    },
    onError: () => toast.error('ไม่สามารถรับทราบ Alert ได้'),
  })

  const resolveMutation = useMutation({
    mutationFn: monitoringService.resolveAlert,
    onSuccess: () => {
      toast.success('ปิด Alert สำเร็จ')
      queryClient.invalidateQueries({ queryKey: ['alerts'] })
      queryClient.invalidateQueries({ queryKey: ['monitoring-overview'] })
    },
    onError: () => toast.error('ไม่สามารถปิด Alert ได้'),
  })

  const escalateMutation = useMutation({
    mutationFn: (id: string) =>
      monitoringService.escalateAlert(id, 'Escalated via Admin Panel'),
    onSuccess: () => {
      toast.success('Escalate Alert สำเร็จ')
      queryClient.invalidateQueries({ queryKey: ['alerts'] })
    },
    onError: () => toast.error('ไม่สามารถ Escalate Alert ได้'),
  })

  const alerts = data?.data ?? []

  return (
    <div className="space-y-4">
      <div className="flex items-center justify-between flex-wrap gap-3">
        <h2 className="text-base font-semibold text-gray-800">
          Alert Management
          {alerts.length > 0 && (
            <span className="ml-2 px-2 py-0.5 bg-red-100 text-red-700 text-xs rounded-full font-medium">
              {alerts.length}
            </span>
          )}
        </h2>

        <div className="flex items-center gap-2">
          <Filter className="w-4 h-4 text-gray-400" />
          <select
            value={statusFilter}
            onChange={(e) => setStatusFilter(e.target.value as AlertStatus | 'all')}
            className="input text-sm w-36 py-1.5"
          >
            <option value="all">ทุกสถานะ</option>
            <option value="open">เปิดอยู่</option>
            <option value="acknowledged">รับทราบแล้ว</option>
            <option value="resolved">แก้ไขแล้ว</option>
          </select>
          <select
            value={severityFilter}
            onChange={(e) => setSeverityFilter(e.target.value as AlertSeverity | 'all')}
            className="input text-sm w-32 py-1.5"
          >
            <option value="all">ทุกระดับ</option>
            <option value="critical">วิกฤต</option>
            <option value="warning">เตือน</option>
            <option value="info">ข้อมูล</option>
          </select>
        </div>
      </div>

      {isLoading ? (
        <div className="space-y-3">
          {Array.from({ length: 3 }).map((_, i) => (
            <div key={i} className="h-20 bg-gray-100 rounded-lg animate-pulse" />
          ))}
        </div>
      ) : alerts.length === 0 ? (
        <div className="card py-10 text-center">
          <CheckCircle className="w-10 h-10 text-green-500 mx-auto mb-2" />
          <p className="text-gray-500">ไม่มี Alerts ที่ตรงกับเงื่อนไข</p>
        </div>
      ) : (
        <div className="space-y-2">
          {alerts.map((alert) => (
            <AlertRow
              key={alert.id}
              alert={alert}
              onAcknowledge={(id) => ackMutation.mutate(id)}
              onResolve={(id) => resolveMutation.mutate(id)}
              onEscalate={(id) => escalateMutation.mutate(id)}
            />
          ))}
        </div>
      )}
    </div>
  )
}
สังเกตว่าเมื่อ resolve alert แล้ว เราทำ invalidateQueries สองตัวพร้อมกัน — ทั้ง alerts และ monitoring-overview เพราะ active alert count บน Overview Cards ต้องอัปเดตด้วย เหมือนปิดตั๋วใน JIRA แล้ว Dashboard ก็ต้อง reflect การเปลี่ยนแปลงนั้นด้วย (◕‿◕)
Step 7: System Health Indicators
ทำไมต้องแยก Service Health ออกมา?
เพราะ “device ออนไลน์” กับ “service ทำงานปกติ” เป็นคนละเรื่องกัน อาจเป็นไปได้ที่ devices ทุกตัว online แต่ MQTT broker กำลังจะพัง — ถ้าไม่มี Service Health เราจะไม่รู้จนกว่า device จะเริ่ม disconnect ออกมา
สร้าง src/components/monitoring/ServiceHealth.tsx:
import { useQuery } from '@tanstack/react-query'
import { clsx } from 'clsx'
import { CheckCircle, AlertCircle, XCircle, Clock } from 'lucide-react'
import { monitoringService } from '@services/monitoring.service'
import type { ServiceHealth } from '@types/monitoring.types'

const HEALTH_CONFIG: Record<ServiceHealth, {
  icon: React.ElementType
  color: string
  label: string
}> = {
  healthy: { icon: CheckCircle, color: 'text-green-500', label: 'ปกติ' },
  degraded: { icon: AlertCircle, color: 'text-yellow-500', label: 'ลดประสิทธิภาพ' },
  down: { icon: XCircle, color: 'text-red-500', label: 'ล่ม' },
}

export function ServiceHealth() {
  const { data, isLoading, dataUpdatedAt } = useQuery({
    queryKey: ['service-health'],
    queryFn: monitoringService.getServiceHealth,
    refetchInterval: 30_000,
  })

  const services = data?.data ?? []

  return (
    <div className="card">
      <div className="flex items-center justify-between mb-4">
        <h3 className="font-semibold text-gray-800">Service Health</h3>
        <div className="flex items-center gap-1 text-xs text-gray-400">
          <Clock className="w-3.5 h-3.5" />
          {dataUpdatedAt > 0
            ? new Date(dataUpdatedAt).toLocaleTimeString('th-TH')
            : 'กำลังโหลด...'}
        </div>
      </div>

      {isLoading ? (
        <div className="space-y-3">
          {Array.from({ length: 5 }).map((_, i) => (
            <div key={i} className="h-10 bg-gray-100 rounded animate-pulse" />
          ))}
        </div>
      ) : (
        <div className="space-y-2">
          {services.map((service) => {
            const config = HEALTH_CONFIG[service.status]
            const Icon = config.icon
            return (
              <div
                key={service.name}
                className="flex items-center justify-between py-2 border-b border-gray-100 last:border-0"
              >
                <div className="flex items-center gap-2">
                  <Icon className={clsx('w-4 h-4', config.color)} />
                  <span className="text-sm font-medium text-gray-700">{service.name}</span>
                </div>
                <div className="flex items-center gap-3 text-xs text-gray-500">
                  {service.latency !== undefined && (
                    <span>{service.latency} ms</span>
                  )}
                  <span
                    className={clsx(
                      'font-medium',
                      service.status === 'healthy' && 'text-green-600',
                      service.status === 'degraded' && 'text-yellow-600',
                      service.status === 'down' && 'text-red-600'
                    )}
                  >
                    {config.label}
                  </span>
                </div>
              </div>
            )
          })}
        </div>
      )}
    </div>
  )
}
Step 8: Data Export Component
ทำไมต้องมี Export?
เพราะบางครั้ง Stakeholder ต้องการข้อมูลไปทำ Report ใน Excel หรือ BI tool อื่น การให้ดาวน์โหลดได้โดยตรงจาก Admin Panel ดีกว่าให้ไปขอ Dev ทุกครั้ง เหมือนมีปุ่ม “เอาข้อมูลออกมาได้เลย” ให้ตัวเอง
สร้าง src/components/monitoring/DataExport.tsx:
import { useState } from 'react'
import { Download, FileText, FileJson } from 'lucide-react'
import { toast } from 'sonner'
import { monitoringService } from '@services/monitoring.service'

export function DataExport() {
  const [format, setFormat] = useState<'csv' | 'json'>('csv')
  const [startDate, setStartDate] = useState(
    new Date(Date.now() - 7 * 24 * 60 * 60 * 1000).toISOString().split('T')[0]
  )
  const [endDate, setEndDate] = useState(new Date().toISOString().split('T')[0])
  const [isExporting, setIsExporting] = useState(false)

  const handleExport = async () => {
    if (!startDate || !endDate) {
      toast.error('กรุณาเลือกช่วงวันที่')
      return
    }
    if (new Date(startDate) > new Date(endDate)) {
      toast.error('วันที่เริ่มต้นต้องก่อนวันที่สิ้นสุด')
      return
    }

    setIsExporting(true)
    try {
      const blob = await monitoringService.exportData({
        format,
        startDate,
        endDate,
      })

      const url = URL.createObjectURL(blob)
      const a = document.createElement('a')
      a.href = url
      a.download = `iot-data-${startDate}-to-${endDate}.${format}`
      a.click()
      URL.revokeObjectURL(url)

      toast.success(`Export ${format.toUpperCase()} สำเร็จ`)
    } catch {
      toast.error('ไม่สามารถ Export ข้อมูลได้')
    } finally {
      setIsExporting(false)
    }
  }

  return (
    <div className="card">
      <h3 className="font-semibold text-gray-800 mb-4">Export ข้อมูล</h3>

      <div className="space-y-4">
        {/* Format Selection */}
        <div>
          <label className="label">รูปแบบไฟล์</label>
          <div className="flex gap-2">
            <button
              onClick={() => setFormat('csv')}
              className={`flex items-center gap-2 px-3 py-2 rounded-lg border text-sm font-medium transition-colors ${
                format === 'csv'
                  ? 'bg-primary-600 text-white border-primary-600'
                  : 'bg-white text-gray-700 border-gray-300 hover:bg-gray-50'
              }`}
            >
              <FileText className="w-4 h-4" />
              CSV
            </button>
            <button
              onClick={() => setFormat('json')}
              className={`flex items-center gap-2 px-3 py-2 rounded-lg border text-sm font-medium transition-colors ${
                format === 'json'
                  ? 'bg-primary-600 text-white border-primary-600'
                  : 'bg-white text-gray-700 border-gray-300 hover:bg-gray-50'
              }`}
            >
              <FileJson className="w-4 h-4" />
              JSON
            </button>
          </div>
        </div>

        {/* Date Range */}
        <div className="grid grid-cols-2 gap-3">
          <div>
            <label className="label">วันที่เริ่มต้น</label>
            <input
              type="date"
              value={startDate}
              onChange={(e) => setStartDate(e.target.value)}
              max={endDate}
              className="input"
            />
          </div>
          <div>
            <label className="label">วันที่สิ้นสุด</label>
            <input
              type="date"
              value={endDate}
              onChange={(e) => setEndDate(e.target.value)}
              min={startDate}
              max={new Date().toISOString().split('T')[0]}
              className="input"
            />
          </div>
        </div>

        <button
          onClick={handleExport}
          disabled={isExporting}
          className="btn-primary w-full"
        >
          <Download className="w-4 h-4 mr-2" />
          {isExporting ? 'กำลัง Export...' : `Export ${format.toUpperCase()}`}
        </button>
      </div>
    </div>
  )
}
เทคนิคเล็กๆ ที่ใช้ตรงนี้คือ URL.createObjectURL(blob) + สร้าง <a> element แล้ว .click() — เป็นวิธีมาตรฐานสำหรับ trigger download ใน browser โดยไม่ต้องเปิดหน้าใหม่ อย่าลืม URL.revokeObjectURL(url) ด้วยนะ เพื่อ release memory
Step 9: MonitoringPage รวมทุก Component
ถึงเวลาเอาทุกชิ้นส่วนมาประกอบกันแล้ว! เหมือนต่อ LEGO ที่ทำชิ้นส่วนแต่ละอันมาเสร็จแล้ว ก็แค่เอามาเสียบเข้าหากัน
สร้าง src/pages/monitoring/MonitoringPage.tsx:
import { useQuery } from '@tanstack/react-query'
import { monitoringService } from '@services/monitoring.service'
import { OverviewCards } from '@components/monitoring/OverviewCards'
import { ChronografEmbed } from '@components/monitoring/ChronografEmbed'
import { DeviceStatusGrid } from '@components/monitoring/DeviceStatusGrid'
import { AlertManagement } from '@components/monitoring/AlertManagement'
import { ServiceHealth } from '@components/monitoring/ServiceHealth'
import { DataExport } from '@components/monitoring/DataExport'
import { PageHeader } from '@components/common/PageHeader'

export default function MonitoringPage() {
  const { data: overview, isLoading } = useQuery({
    queryKey: ['monitoring-overview'],
    queryFn: monitoringService.getSystemOverview,
    refetchInterval: 30_000,
  })

  return (
    <div className="space-y-6">
      <PageHeader
        title="Monitoring Dashboard"
        description="ติดตามสถานะระบบและอุปกรณ์ IoT แบบ Real-time"
      />

      {/* Overview Cards */}
      {isLoading ? (
        <div className="grid grid-cols-2 lg:grid-cols-4 gap-4">
          {Array.from({ length: 6 }).map((_, i) => (
            <div key={i} className="h-28 bg-gray-100 rounded-xl animate-pulse" />
          ))}
        </div>
      ) : (
        overview?.data && <OverviewCards data={overview.data} />
      )}

      {/* Chronograf */}
      <div>
        <h2 className="text-base font-semibold text-gray-800 mb-3">
          Chronograf Dashboards
        </h2>
        <ChronografEmbed height={500} />
      </div>

      {/* Device Status */}
      <DeviceStatusGrid />

      {/* Alerts + Health + Export */}
      <div className="grid grid-cols-1 lg:grid-cols-3 gap-6">
        <div className="lg:col-span-2">
          <AlertManagement />
        </div>
        <div className="space-y-4">
          <ServiceHealth />
          <DataExport />
        </div>
      </div>
    </div>
  )
}
Layout เป็น 3 คอลัมน์ที่ด้านล่าง — AlertManagement ใช้ 2 ส่วน และ sidebar ขวาคือ ServiceHealth + DataExport ซ้อนกัน ออกแบบมาให้ข้อมูลที่สำคัญกว่า (alerts) ได้พื้นที่มากกว่า
หน้า Monitoring จริงเป็นแบบนี้
มาดูของจริงกัน! รูปนี้คือหน้า Monitoring ที่รันด้วย E2E test (Playwright) ยิงไปที่ backend จริง — มีการ์ดสรุปด้านบน (total / online / not online / alert rules), grid สถานะ device ทุกตัวที่จะ “ติดไฟ” เมื่อมีข้อมูล real-time เข้ามา, แผงสรุป alert rules แยกตาม severity/type ทางขวา และที่เด็ดสุดคือ กราฟ readings ด้านล่างที่ดึงข้อมูลจริงจาก InfluxDB มาวาดเป็นเส้น sensor ตามช่วงเวลาที่เลือก (1h / 6h / 24h / 7d):
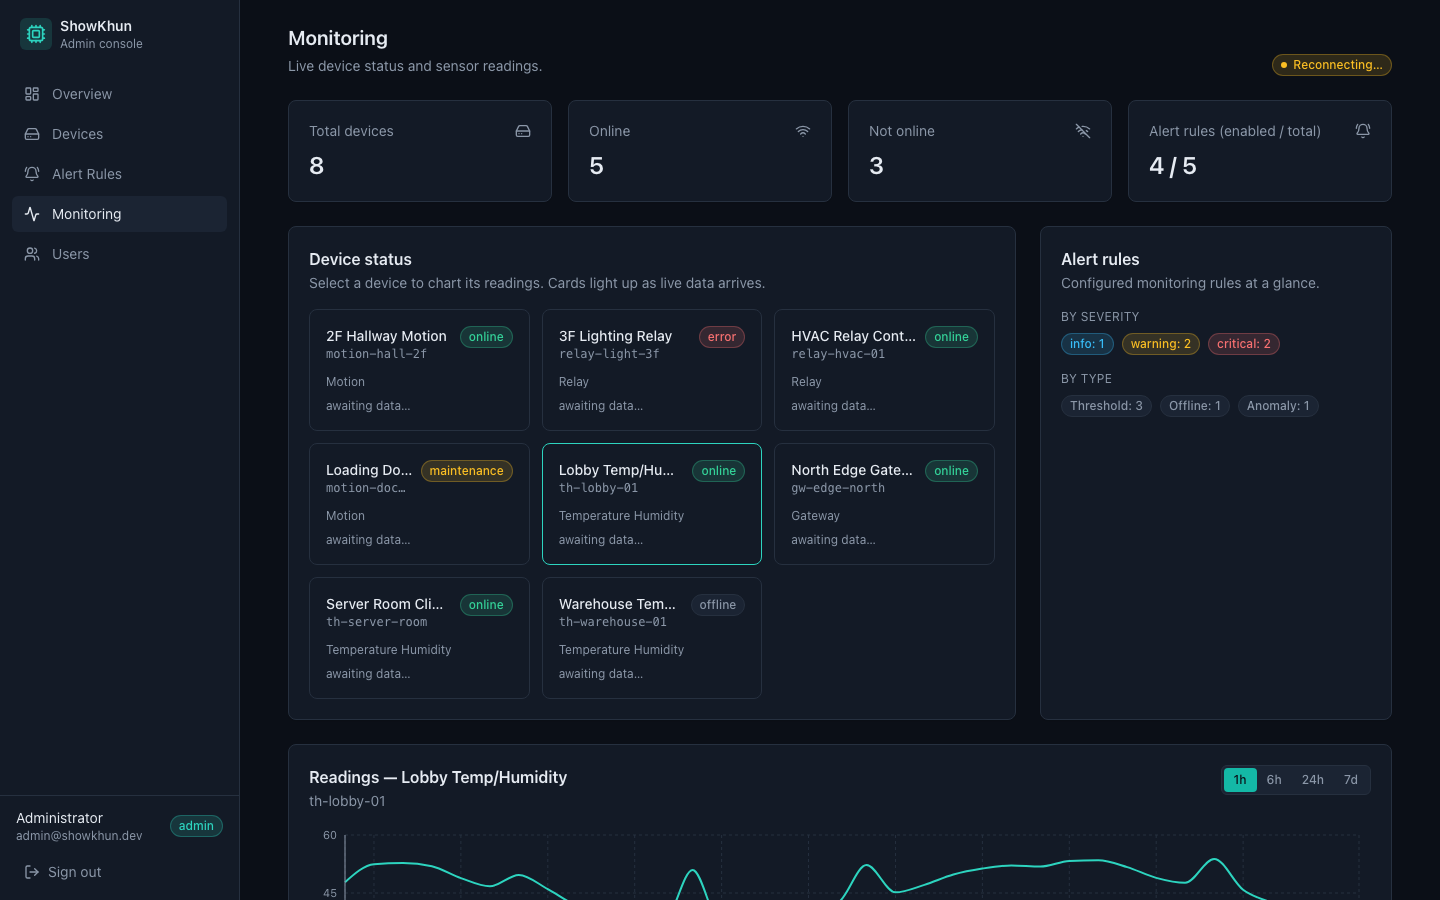
เห็นกราฟเส้นสีฟ้าด้านล่างมั้ย? นั่นคือข้อมูล sensor จริงที่เรา ingest เข้า InfluxDB แล้ว query กลับมาวาด — ไม่ใช่ภาพ mock นะ ของจริงล้วนๆ
สรุปสิ่งที่สร้างวันนี้
น้องๆ ทำได้แล้ว! (ノ◕ヮ◕)ノ*:・゚✧ มาดูกันว่าเราสร้างอะไรไปบ้าง:
| Component | ฟีเจอร์หลัก | Refresh interval |
|---|---|---|
OverviewCards |
สรุปตัวเลขสถานะระบบ + traffic light | 30 วิ |
ChronografEmbed |
Iframe + tab switching + fullscreen | Manual |
DeviceStatusGrid |
Grid cards พร้อม metrics real-time | 30 วิ |
AlertManagement |
ดู/รับทราบ/ปิด/Escalate alerts | 60 วิ |
ServiceHealth |
สถานะ services ทุกตัว + latency | 30 วิ |
DataExport |
Export CSV/JSON ตามช่วงวันที่ | On demand |
ข้อควรระวัง 3 ข้อ:
- Chronograf Iframe — ต้องตั้งค่า CORS และ
X-Frame-Optionsให้อนุญาต domain ของ Admin Panel ก่อน ไม่งั้น iframe จะ blank - Real-time vs WebSocket — ใช้
refetchIntervalแทน WebSocket สำหรับข้อมูลที่ไม่ต้องการ latency ต่ำมาก เพราะง่ายกว่าและเพียงพอ - Blob Export — ต้องใช้
responseType: 'blob'ใน Axios และอย่าลืมURL.revokeObjectURL()หลังดาวน์โหลดเสร็จ
Next Step
Workshop หน้าเราจะไปสร้าง Authentication & RBAC — จะทำให้ Admin Panel มี role-based access control เพื่อแยกว่าใครเข้าถึงหน้าไหนได้บ้าง
มาลุยกัน workshop หน้าด้วยนะน้องๆ! (•̀ᴗ•́)و
- ก่อนหน้า: Workshop #19: Admin CRUD Operations
- ถัดไป: Workshop #21: Authentication & RBAC